Coverage
We have created an initial list of test cases. The tests in the tests/api
directory test Items via the API. But how do we know whether these tests
comprehensively test our code? This is where code coverage comes into play.
Tools that measure code coverage observe your code while a test suite is running and record which lines are passed and which are not. This measure – known as line coverage – is calculated by dividing the total number of executed lines by the total number of lines of code. Code coverage tools can also tell you whether all paths in control statements are traversed, a measurement known as branch coverage.
However, code coverage cannot tell you if your test suite is good; it can only tell you how much of the application code is being traversed by your test suite.
Coverage.py is the favourite Python tool that measures code coverage. And pytest-cov is a popular pytest plugin that is often used in conjunction with Coverage.py.
Using Coverage.py with pytest-cov
Both Coverage.py and pytest-cov are third-party packages that must be installed before use:
You can create a report for the test coverage with Coverage.py.
$ bin/python -m pip install coverage pytest-cov
C:> Scripts\python -m pip install coverage pytest-cov
Note
If you want to determine the test coverage for Python 2 and Python<3.6, you must use Coverage<6.0.
To run tests with Coverage.py, you need to add the --cov option and specify
either a path to the code you want to measure or the installed package you are
testing. In our case, the Items project is an installed package, so we will test
it with --cov=items.
The normal pytest output is followed by the coverage report, as shown here:
$ cd /PATH/TO/items
$ python3 -m venv .
$ . bin/activate
$ python -m pip install ".[dev]"
$ pytest --cov=items
============================= test session starts ==============================
...
rootdir: /Users/veit/cusy/prj/items
configfile: pyproject.toml
testpaths: tests
plugins: cov-4.1.0, Faker-19.11.0
collected 35 items

tests/api/test_add.py ....                                               [ 11%]
tests/api/test_config.py .                                               [ 14%]
tests/api/test_count.py ...                                              [ 22%]
tests/api/test_delete.py ...                                             [ 31%]
tests/api/test_finish.py ....                                            [ 42%]
tests/api/test_list.py .........                                         [ 68%]
tests/api/test_start.py ....                                             [ 80%]
tests/api/test_update.py ....                                            [ 91%]
tests/api/test_version.py .                                              [ 94%]
tests/cli/test_add.py ..                                                 [100%]

---------- coverage: platform darwin, python 3.11.5-final-0 ----------
Name                    Stmts   Miss  Cover
-------------------------------------------
src/items/__init__.py       3      0   100%
src/items/api.py           70      1    99%
src/items/cli.py           38      9    76%
src/items/db.py            23      0   100%
-------------------------------------------
TOTAL                     134     10    93%


============================== 35 passed in 0.11s ==============================
The previous output was generated by coverage’s reporting functions, although we
did not call coverage directly. pytest --cov=items instructed the
pytest-cov plugin to
set
coveragetoitemswith--sourcewhile running pytest with the testsexecute
coveragereport for the line coverage report
Without pytest-cov, the commands would look like this:
$ coverage run --source=items -m pytest
$ coverage report
The files __init__.py and db.py have a coverage of 100%, which
means that our test suite hits every line in these files. However, this does not
tell us that it is sufficiently tested or that the tests detect possible errors;
but it at least tells us that every line was executed during the test suite.
The cli.py file has a coverage of 76%. This may seem surprisingly high as
we have not tested the CLI at all. However, this is due to the fact that
cli.py is imported by __init__.py, so that all function
definitions are executed, but none of the function contents.
However, we are really interested in the api.py file with 99% test
coverage. We can find out what was missed by re-running the tests and adding the
--cov-report=term-missing option:
pytest --cov=items --cov-report=term-missing
============================= test session starts ==============================
...
rootdir: /Users/veit/cusy/prj/items
configfile: pyproject.toml
testpaths: tests
plugins: cov-4.1.0, Faker-19.11.0
collected 35 items

tests/api/test_add.py ....                                               [ 11%]
tests/api/test_config.py .                                               [ 14%]
tests/api/test_count.py ...                                              [ 22%]
tests/api/test_delete.py ...                                             [ 31%]
tests/api/test_finish.py ....                                            [ 42%]
tests/api/test_list.py .........                                         [ 68%]
tests/api/test_start.py ....                                             [ 80%]
tests/api/test_update.py ....                                            [ 91%]
tests/api/test_version.py .                                              [ 94%]
tests/cli/test_add.py ..                                                 [100%]

---------- coverage: platform darwin, python 3.11.5-final-0 ----------
Name                    Stmts   Miss  Cover   Missing
-----------------------------------------------------
src/items/__init__.py       3      0   100%
src/items/api.py           68      1    99%   52
src/items/cli.py           38      9    76%   18-19, 25, 39-43, 51
src/items/db.py            23      0   100%
-----------------------------------------------------
TOTAL                     132     10    92%


============================== 35 passed in 0.11s ==============================
Now that we have the line numbers of the untested lines, we can open the files in an editor and view the missing lines. However, it is easier to look at the HTML report.
See also
Generate HTML reports
With Coverage.py we can generate HTML reports to view the coverage data in more
detail. The report is generated either with the option --cov-report=html or
by executing coverage html after a previous coverage run:
$ cd /PATH/TO/items
$ python3 -m venv .
$ . bin/acitvate
$ python -m pip install ".[dev]"
$ pytest --cov=items --cov-report=html
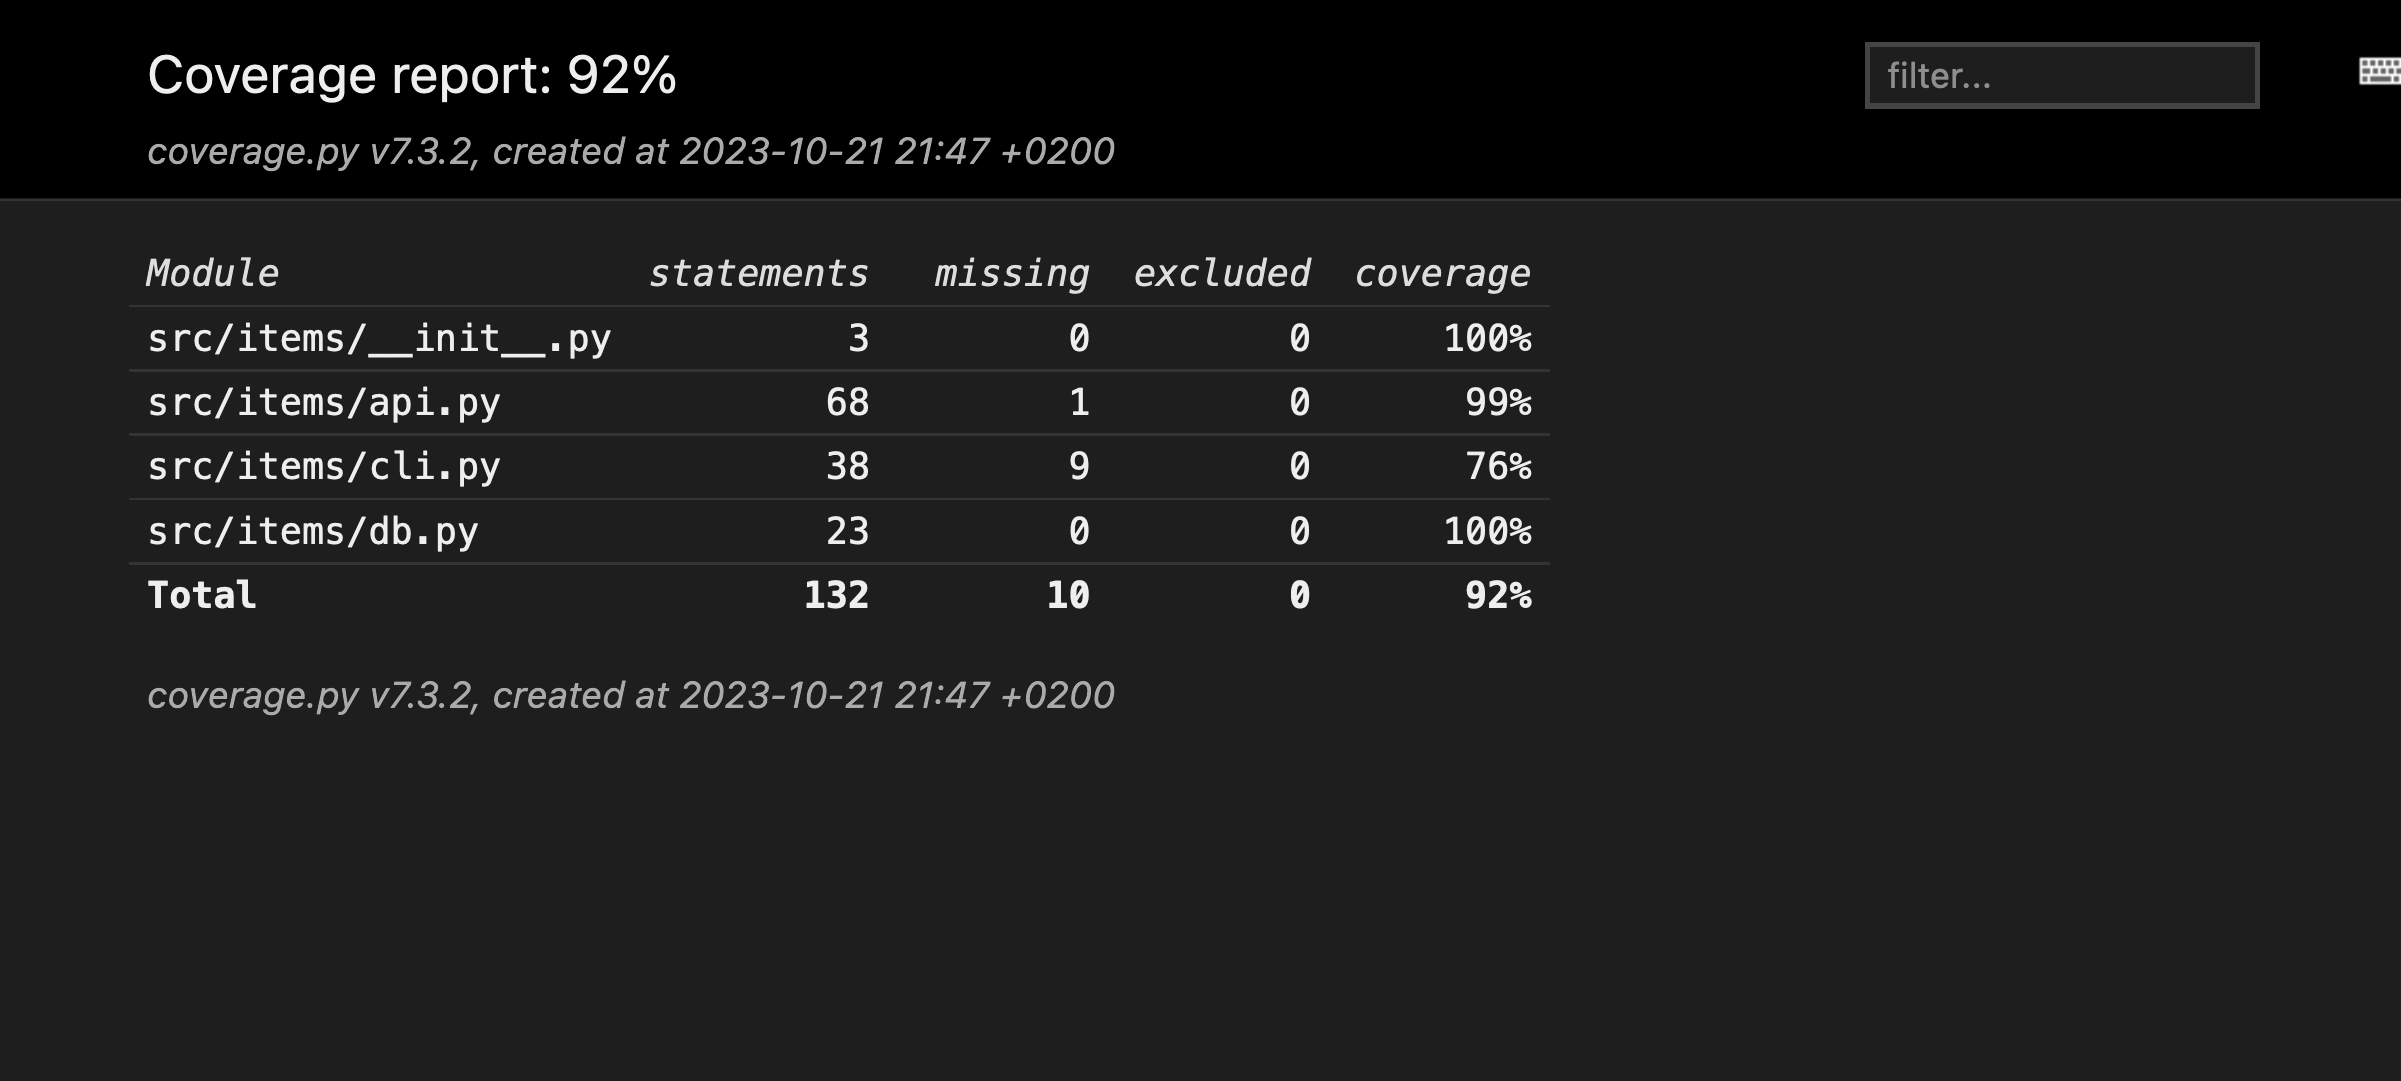
Both commands will prompt Coverage.py to create an HTML report in the
htmlcov/ directory. Open htmlcov/index.html with a browser and
you should see the following:
If you click on the src/items/api.py: file, a report for this file is
displayed:
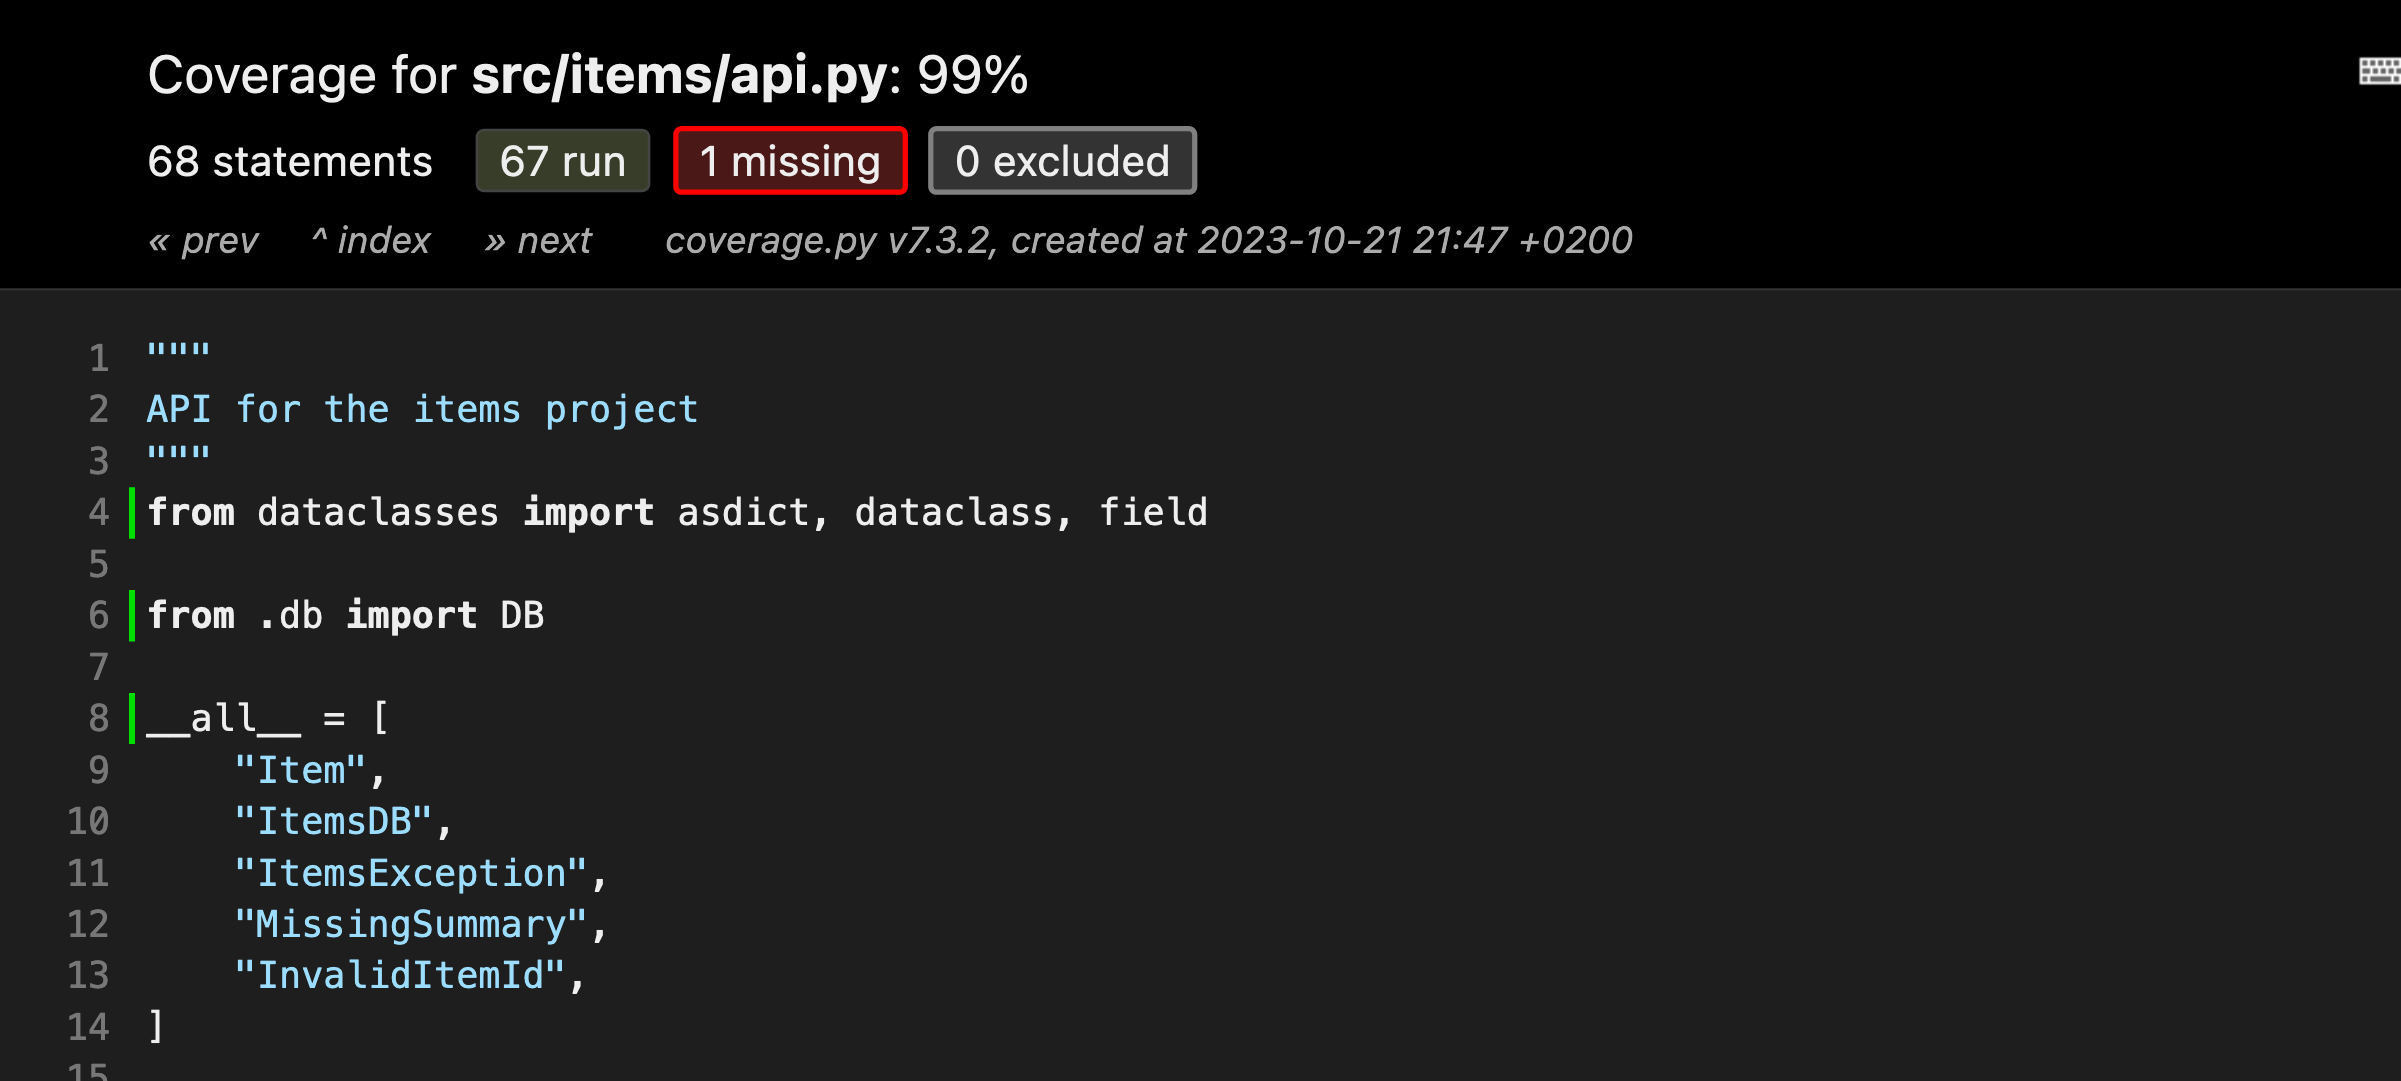
The upper part of the report shows the percentage of rows covered (99%), the total number of statements (68) and how many statements were executed (67), missed (1) and excluded (0). Click on to highlight the rows that were not executed:
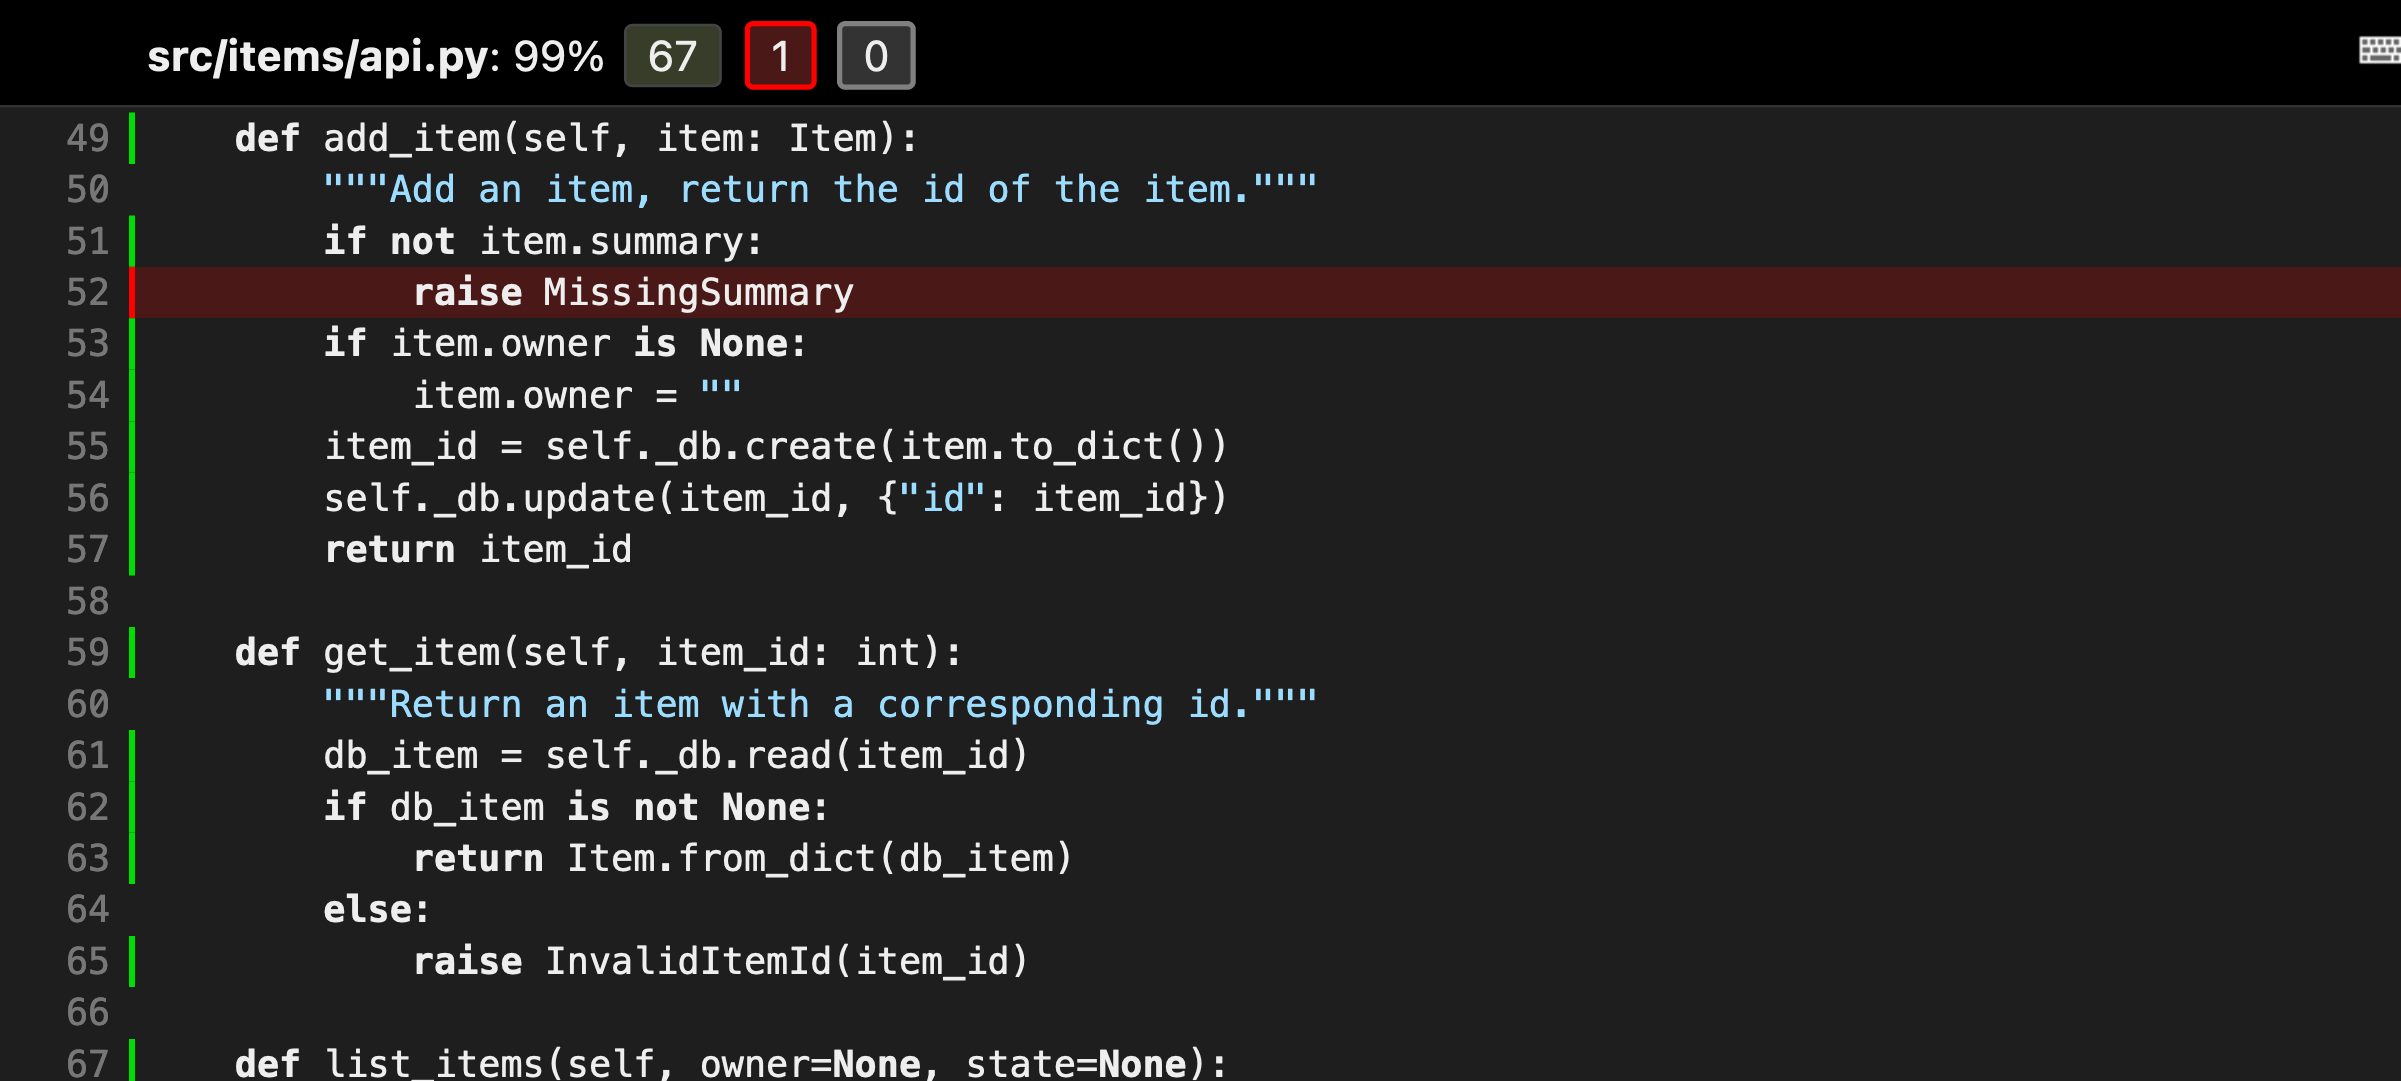
It looks like the function add_item() has an exception
MissingSummary, which is not tested yet.
Exclude code from test coverage
In the HTML reports you will find a column with the specification 0 excluded. This refers to a function of Coverage.py that allows us to exclude some lines from the check. We do not exclude anything in items. However, it is not uncommon for some lines of code to be excluded from the test coverage calculation, for example modules that are to be both imported and executed directly may contain a block that looks something like this:
if __name__ == '__main__':
    main()
This command tells Python to execute main() when we call the module
directly with python my_module.py, but not to execute the code when the
module is imported. These types of code blocks are often excluded from testing
with a simple pragma statement:
if __name__ == '__main__': # pragma: no cover
    main()
This instructs Coverage.py to exclude either a single line or a block of code.
If, as in this case, the pragma is in the if statement, you do not have to
insert it into both lines of code.
Alternatively, this can also be configured for all occurrences:
[run]
branch = True

[report]
; Regexes for lines to exclude from consideration
exclude_also =

    ; Don’t complain if tests don’t hit defensive assertion code:
    raise AssertionError
    raise NotImplementedError

    ; Don't complain if non-runnable code isn’t run:
    if __name__ == .__main__.:

ignore_errors = True

[html]
directory = coverage_html_report
[tool.coverage.run]
branch = true

[tool.coverage.report]
# Regexes for lines to exclude from consideration
exclude_also = [
    # Don’t complain if tests don’t hit defensive assertion code:
    "raise AssertionError",
    "raise NotImplementedError",

    # Don’t complain if non-runnable code isn’t run:
    "if __name__ == .__main__.:",
    ]

ignore_errors = true

[tool.coverage.html]
directory = "coverage_html_report"
[coverage:run]
branch = True

[coverage:report]
; Regexes for lines to exclude from consideration
exclude_also =

    ; Don’t complain if tests don’t hit defensive assertion code:
    raise AssertionError
    raise NotImplementedError

    ; Don’t complain if non-runnable code isn’t run:
    if __name__ == .__main__.:

ignore_errors = True

[coverage:html]
directory = coverage_html_report
See also
Extensions
In Coverage.py plugins you will also find a number of extensions for Coverage.
Test coverage of all tests with GitHub actions
After you have checked the test coverage, you can upload the files as GitHub
actions, for example in a ci.yaml as artefacts, so that you can reuse
them later in other jobs:
45      - name: Upload coverage data
46        uses: actions/upload-artifact@v4
47        with:
48          name: coverage-data
49          path: .coverage.*
50          if-no-files-found: ignore
if-no-files-found: ignoreis useful if you don’t want to measure the test coverage for all Python versions in order to get results faster. You should therefore only upload the data for those elements of your matrix that you want to take into account.
After all the tests have been run, you can define another job that summarises the results:
52  coverage:
53    name: Combine and check coverage
54    needs: tests
55    runs-on: ubuntu-latest
56    steps:
57      - name: Check out the repo
58        uses: actions/checkout@v4
59
60      - name: Set up Python
61        uses: actions/setup-python@v5
62        with:
63          python-version: 3.12
64
65      - name: Install dependencies
66        run: |
67          python -m pip install --upgrade coverage[toml]
68
69      - name: Download coverage data
70        uses: actions/download-artifact@v4
71        with:
72          name: coverage-data
73
74      - name: Combine coverage and fail it it’s under 100 %
75        run: |
76          python -m coverage combine
77          python -m coverage html --skip-covered --skip-empty
78
79          # Report and write to summary.
80          python -m coverage report | sed 's/^/    /' >> $GITHUB_STEP_SUMMARY
81
82          # Report again and fail if under 100%.
83          python -Im coverage report --fail-under=100
84
85      - name: Upload HTML report if check failed
86        uses: actions/upload-artifact@v4
87        with:
88          name: html-report
89          path: htmlcov
90        if: ${{ failure() }}
needs: testsensures that all tests are performed. If your job that runs the tests has a different name, you will need to change it here.
name: "Download coverage data"downloads the test coverage data that was previously uploaded with
name: "Upload coverage data".name: "Combine coverage and fail it it’s under 100 %"combines the test coverage and creates an HTML report if the condition
--fail-under=100is met.
Once the workflow is complete, you can download the HTML report under .
Badge
You can use GitHub Actions to create a badge with your code coverage. A GitHub
Gist is also required to store the parameters for the badge, which is rendered by
shields.io. To do this, we extend our ci.yaml
as follows:
 92      - name: Create badge
 93        uses: schneegans/dynamic-badges-action@v1.7.0
 94        with:
 95          auth: ${{ secrets.GIST_TOKEN }}
 96          gistID: YOUR_GIST_ID
 97          filename: covbadge.json
 98          label: Coverage
 99          message: ${{ env.total }}%
100          minColorRange: 50
101          maxColorRange: 90
102          valColorRange: ${{ env.total }}
- Line 97
GIST_TOKENis a personal GitHub access token.- Line 98
You should replace
YOUR_GIST_IDwith your own Gist ID. If you don’t have a Gist ID yet, you can create one with:Call up https://gist.github.com and create a new gist, which you can name
test.json, for example. The ID of the gist is the long alphanumeric part of the URL that you need here.Then go to https://github.com/settings/tokens and create a new token with the gist area.
Finally, go to and add this token. You can give it any name you like, for example
GIST_SECRET.If you use Dependabot to automatically update the dependencies of your repository, you must also add the
GIST_SECRETin .
- Lines 102-104
The badge is automatically coloured:
≤ 50 % in red
≥ 90 % in green
with a colour gradient between the two
Now the badge can be displayed with a URL like this:
https://img.shields.io/endpoint?url=https://gist.githubusercontent.com/YOUR_GITHUB_NAME/GIST_SECRET/raw/covbadge.json.


